
On Wed, Nov 5, 2014 at 9:28 AM, Alexandre Bergel alexandre.bergel@me.com wrote: [snip]
Something like this is not enough?
Cheers, Alexandre
[snip]
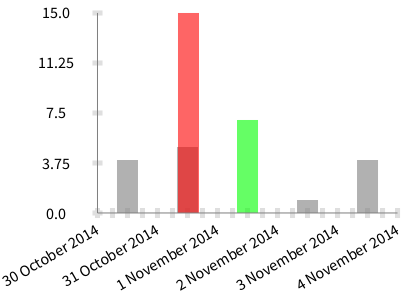
Well, I usually think of the lined graph as impying a continuity between the points; I want to state that it happened at a specific time, with nothing in between. I also kinda like the bars in that is draws attention to them; the dots are to easy to overlook (especially the color, to my eyes).
So, I've taken some of these ideas and gotten the timing down better, and applied alpha so that I can see overlapping bars. This might be good enough for now, at least for me.
-=-=-=-=-=-=-=-=-=-=-=-=-=-=-= data := { Dictionary new at: 'COLOR' put: Color gray; at: 'TIME' put: (DateAndTime fromString: '2014-10-30 12:11:28.0'); at: 'SECONDS' put: 4; yourself. Dictionary new at: 'COLOR' put: Color gray; at: 'TIME' put: (DateAndTime fromString: '2014-10-31 12:11:28.0'); at: 'SECONDS' put: 5; yourself. Dictionary new at: 'COLOR' put: Color red; at: 'TIME' put: (DateAndTime fromString: '2014-10-31 12:41:28.0'); at: 'SECONDS' put: 15; yourself. Dictionary new at: 'COLOR' put: Color green; at: 'TIME' put: (DateAndTime fromString: '2014-11-01 12:11:28.0'); at: 'SECONDS' put: 7; yourself. Dictionary new at: 'COLOR' put: Color gray; at: 'TIME' put: (DateAndTime fromString: '2014-11-02 12:11:28.0'); at: 'SECONDS' put: 1; yourself. Dictionary new at: 'COLOR' put: Color gray; at: 'TIME' put: (DateAndTime fromString: '2014-11-03 12:11:28.0'); at: 'SECONDS' put: 4; yourself. }. oldestEntryDate := (data collect: [ :entry | (entry at: 'TIME') asDate asDateAndTime asUnixTime ]) min. newestEntryDate := (data collect: [ :entry | (entry at: 'TIME') asUnixTime ]) max. newestEntryDate = (DateAndTime fromUnixTime: newestEntryDate) asTime seconds = 0 ifFalse: [ newestEntryDate := ((DateAndTime fromUnixTime: newestEntryDate) asDate + 1 day) asDateAndTime asUnixTime. data := data copyWith: (Dictionary new at: 'COLOR' put: Color white; at: 'TIME' put: (DateAndTime fromUnixTime: newestEntryDate); at: 'SECONDS' put: 0; yourself). ].
ticks := (newestEntryDate - oldestEntryDate) asDuration asDays asInteger * 4.
b := RTCharterBuilder new. b extent: 300 @ 200. b interaction popupText: [:entry | (entry at: 'TIME') asString, ' took ', (entry at: 'SECONDS') asString, ' seconds']; highlightColored: Color blue.
b shape rectangle color: [ :entry | (entry at: 'COLOR' ) alpha: 0.6]; size: 0. b points: data. b y: [ :entry | entry at: 'SECONDS' ]. b allX: [ :v | (v at: 'TIME') asUnixTime - oldestEntryDate ]. b histogramWithBarTitle: [ :entry | '' ].
b axisY. b axisConfiguration title: ''; labelRotation: -30; numberOfTicks: ticks; numberOfLabels: ticks; labelConvertion: [ :v | |lbl| lbl := DateAndTime fromUnixTime: v + oldestEntryDate. lbl asTime asSeconds = 0 ifTrue: [ lbl asDate ] ifFalse: [ '' ] ]. b axisX. b build. b view -=-=-=-=-=-=-=-=-=-=-=-=-=-=-=
[image: Inline image 1]
And, incidentally, I'm really enjoying the playground. Great fun!
-cbc