
12 Dec
2014
12 Dec
'14
8:18 p.m.
Hi!
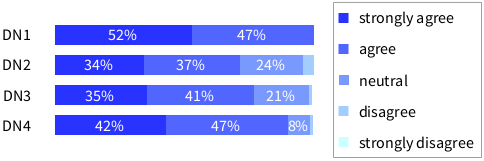
Today Andrei and I pair-programmed on a stack bar plot builder.
Here is an example: -=-=-=-=-=-=-=-=-=-=-=-=-=-=-=-= b := RTStackBarPlot new. b interaction popupText. b colorPalette colors: { Color blue . Color lightBlue }. b add: #(37 33 0 0 0) title: 'DN1'. b add: #(24 26 17 3 0) title: 'DN2'. b add: #(25 29 15 1 0) title: 'DN3'. b add: #(30 33 6 1 0) title: 'DN4'. b addLegend: #('strongly agree' 'agree' 'neutral' 'disagree' 'strongly disagree'). b barWidth: 260 height: 20.
b addLabelToBars: [ :assoc | (assoc key / b totalSum * 100) asInteger asString, '%' ] if: [:assoc | assoc key > 5 ] color: Color white.
b build. -=-=-=-=-=-=-=-=-=-=-=-=-=-=-=-=
Result is the following:
Cheers, Andrei & Alexandre
--
_,.;:~^~:;._,.;:~^~:;._,.;:~^~:;._,.;:~^~:;._,.;:
Alexandre Bergel http://www.bergel.eu
^~:;._,.;:~^~:;._,.;:~^~:;._,.;:~^~:;._,.;:~^~:;.