
Dear Alexandre,
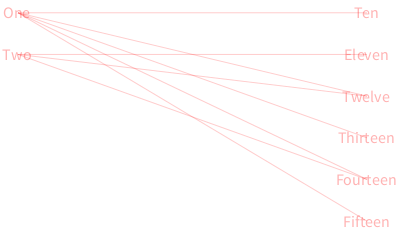
thanks for your initial version of the script. As promised, here is the adapted version of what I basically would like to achieve:
[image: Inline image 1]
======= "configuration" spaceBetweenLine := 350. lineHeight := 250.
"data" columns := #( #('One' 'Two') #('Ten' 'Eleven' 'Twelve' 'Thirteen' 'Fourteen' 'Fifteen') ). values := #( #(1 3 4 5 6) #(2 3 5) ).
numberOfColumns := columns size. columnHeight := columns reduce: [ :c1 :c2 | (c1 size) max: (c2 size) ].
v := RTView new. label := RTLabel text: [ :t | t ]. label color: (Color red alpha: 0.3).
"draw labels" setOfElements := OrderedCollection new. 1 to: numberOfColumns do: [ :i | | t labels | t := OrderedCollection new. labels := label elementsOn: (columns at: i). labels doWithIndex: [ :element :index | t add: element. element translateTo: (i * (spaceBetweenLine - 1)) @ (index * lineHeight / columnHeight). v add: element ]. setOfElements add: t. ].
"draw lines" 2 to: numberOfColumns do: [ :column | values doWithIndex: [ :setOfValues :index | setOfValues do: [ :toIndex | line := (RTLine new color: (Color red alpha: 0.2)) edgeFrom: ((setOfElements at: (column - 1)) at: index) to: ((setOfElements at: column) at: toIndex). v add: line ]. ]. ]. v =======
Now it only needs to be made a bit prettier (e.g. starting the lines at the edges of the label, not in the middle; make it deal correctly with multiple columns; ...).
Thank you very much, Manfred
On Mon, May 4, 2015 at 11:01 PM, Alexandre Bergel alexandre.bergel@me.com wrote:
Ok, let us know!
Cheers, Alexandre -- _,.;:~^~:;._,.;:~^~:;._,.;:~^~:;._,.;:~^~:;._,.;: Alexandre Bergel http://www.bergel.eu ^~:;._,.;:~^~:;._,.;:~^~:;._,.;:~^~:;._,.;:~^~:;.
On May 4, 2015, at 3:23 PM, Manfred Kröhnert mkroehnert42@googlemail.com wrote:
Hi Alexandre,
thanks for the fast response and the nice script. I'll see if I can use it to produce the graph I'd like to have.
Best, Manfred
On Mon, May 4, 2015 at 5:06 PM, Alexandre Bergel alexandre.bergel@me.com wrote:
Hi Manfred,
The parallel coordinates is indeed easy to obtain in Roassal.
Here is a short example:
"Configuration" maxValue := 40. spaceBetweenLine := 50. lineHeight := 250. numberOfColumns := 10. numberOfLines := 200.
"Script" values := OrderedCollection new. numberOfLines timesRepeat: [ t := OrderedCollection new. numberOfColumns timesRepeat: [ t add: maxValue atRandom ]. values add: t. ].
v := RTView new. setOfElements := OrderedCollection new. 1 to: numberOfColumns do: [ :i | t := OrderedCollection new. values do: [ :setOfValues | e := (RTEllipse new color: (Color red alpha: 0.3)) element. t add: e. e translateTo: (i * (spaceBetweenLine - 1)) @ ((setOfValues at: i) * lineHeight / maxValue) asFloat. v add: e. ]. setOfElements add: t. ].
2 to: numberOfColumns do: [ :column | t := OrderedCollection new. values doWithIndex: [ :setOfValues :index | line := (RTLine new color: (Color red alpha: 0.2)) edgeFrom: ((setOfElements at: (column - 1)) at: index) to: ((setOfElements at: column) at: index). v add: line. ]. ]. v -=-=-=-=-=-=-=-=-=-=-=-=
Best would be to define a new builder to allow for easy configuration. It would be easy to add colors
Cheers, Alexandre -- _,.;:~^~:;._,.;:~^~:;._,.;:~^~:;._,.;:~^~:;._,.;: Alexandre Bergel http://www.bergel.eu ^~:;._,.;:~^~:;._,.;:~^~:;._,.;:~^~:;._,.;:~^~:;.
On May 4, 2015, at 5:38 AM, Manfred Kröhnert mkroehnert42@googlemail.com wrote:
Hi everyone,
some time ago I saw a diagram consisting of two columns of words and lines showing associations between the words in both columns. It looked similar to the "parallel coordinates" diagram from this link: http://homes.cs.washington.edu/~jheer/files/zoo/ but with only two columns.
Now, I am not sure if I saw this in an email on a Pharo or Moose list and wanted to ask if it is already possible to create such diagrams with Roassal.
Thank you very much, Manfred