
That is perfect! Thanks Alexandre.
El mar., 7 de abr. de 2015 a la(s) 8:04 p. m., Alexandre Bergel < alexandre.bergel@me.com> escribió:
Hi Demian,
Thanks for your question. This part of Grapher is not well documented, so no surprise that you bump into this.
Consider the slightly adapted example. Does this help you?
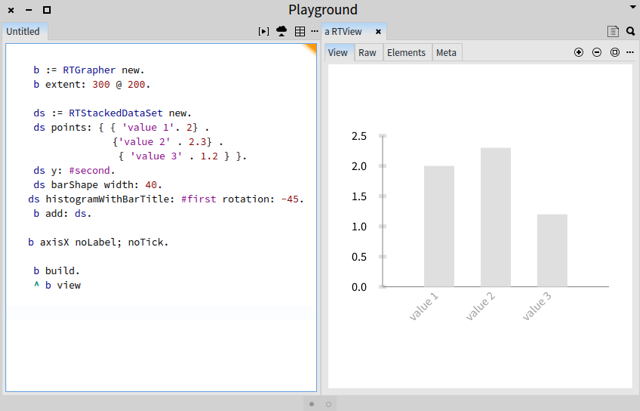
b := RTGrapher new.
b extent: 300 @ 200.

ds := RTStackedDataSet new.
ds points: { { 'value 1'. 2} .
{'value 2' . 2.3} . { 'value 3' . 1.2 } }. ds y: #second. ds barShape width: 40. ds histogramWithBarTitle: #first rotation: -45. b add: ds.
b axisX noLabel; noTick. b build. ^ b view -=-=-=-=-=-=-=-=-=-=-=-=-=-=-=-=-=-=-=-=
Cheers, Alexandre -- _,.;:~^~:;._,.;:~^~:;._,.;:~^~:;._,.;:~^~:;._,.;: Alexandre Bergel http://www.bergel.eu ^~:;._,.;:~^~:;._,.;:~^~:;._,.;:~^~:;._,.;:~^~:;.
On Apr 7, 2015, at 6:38 PM, Demian Schkolnik demianschkolnik@gmail.com wrote:
Hi all! I want to make a little graph of a vector, with bars:
| b ds labels | b := RTGrapher new. b extent: 300 @ 200.
ds := RTStackedDataSet new.
ds points: { 2 . 2.3 . 1.2 }.

ds barShape width: 40.
b add: ds.
labels := #(x y z - -).
b axisX numberOfLabels:labels size-1.
b axisX numberOfTicks:labels size-1.
b axisX labelConvertion: [ :item | labels at:item +1].
b build.
^ b view
The code above writes the x 2 times. I just want an x, y and z under each one of the bars. Also, I havo to do the 'item+1' thing because it somehow starts at 0, and smalltalk arrays start at 1...
Thanks!
Moose-dev mailing list Moose-dev@iam.unibe.ch https://www.iam.unibe.ch/mailman/listinfo/moose-dev
Moose-dev mailing list Moose-dev@iam.unibe.ch https://www.iam.unibe.ch/mailman/listinfo/moose-dev